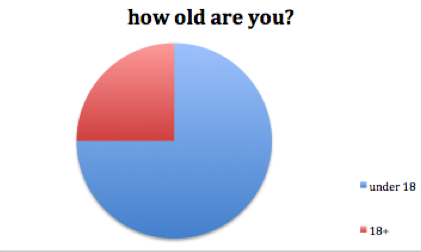
We decided to include pie charts of our survey results in our research because it's a more visual and collective way of looking at our results. It's an easier and more simple way of seeing what our surveys have helped us find out about our target audience and which direction we have to move in. For instance, a lot of the people we surveyed liked the song 'Radioactive' which we could then take into consideration that maybe that'd be a good song to produce our video for. The point of pie charts are all about being able to guide decisions we make in a logical and tactical way to make sure we hit the expectations of our target audience.


Judging by our results from the pie charts I think that we're going to go with the song "Roc The Life" since even though it didn't get a high amount of votes from our survey takers, we decided this would give us more freedom in coming up with a music video from our own creativity without having to worry about pre-assumptions or expectations that our target audience may already have of the song. We also decided that since a lot of our survey takers who did like Rita Ora when on to say how their main genres to listen to were usually Dance, Pop and R&B that we'd stick to a music video that is a crossover between performance and narrative based since these are the most common two videos of these genres, which means we will also be conventional to the target audience, ultimately appealing to them more.
Your pie charts help to show your results that you received well. Now you need to consider a potential style and concept for your music video, based on your results
ReplyDeleteThis post now demonstrates some understanding of the research that you carried out. You have also started to consider a possible style and song, but further detail is still needed.
ReplyDelete